
On NFL Turnovers
In my previous post I talked about scraping NFL data from pro-football-reference in hopes of finding some interesting trends with it. Today we’ll do some basic analysis of NFL turnovers from the data we scraped previously.
I’ve taken the script we wrote last time and downloaded the season data from every NFL game since 1960. You can grab that file here. I generated that file using the script here which is just calling the script we wrote last time for each team and year we’re interested in.
OK let’s get started. First let’s define the main metric that I used for this as turnover margin which is the difference between the number of turnovers committed by the offense and the number of turnovers forced by the defence. So for example, a turnover margin of +2 means that the defense forced two more turnovers than the offense gave away.
Great, so let’s take a look at a histogram of turnover margin for all the games we’ve collected:
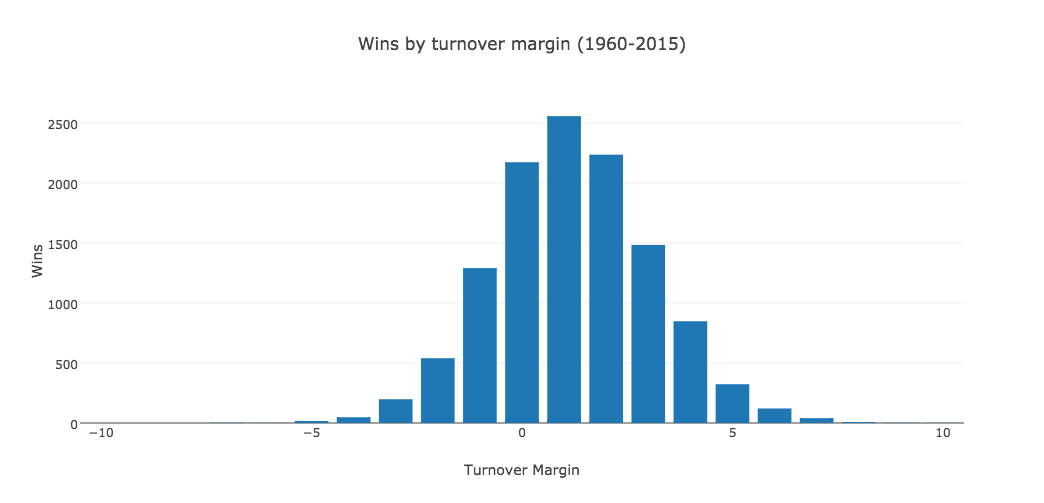
Most of the winning teams had a turnover margin between 0 and +2 with the greatest number of occurrences in the +1 turnover margin.
Now let’s look at turnover margin versus win percentage which is the number of wins at a turnover margin divided by the total number of games at that turnover margin:
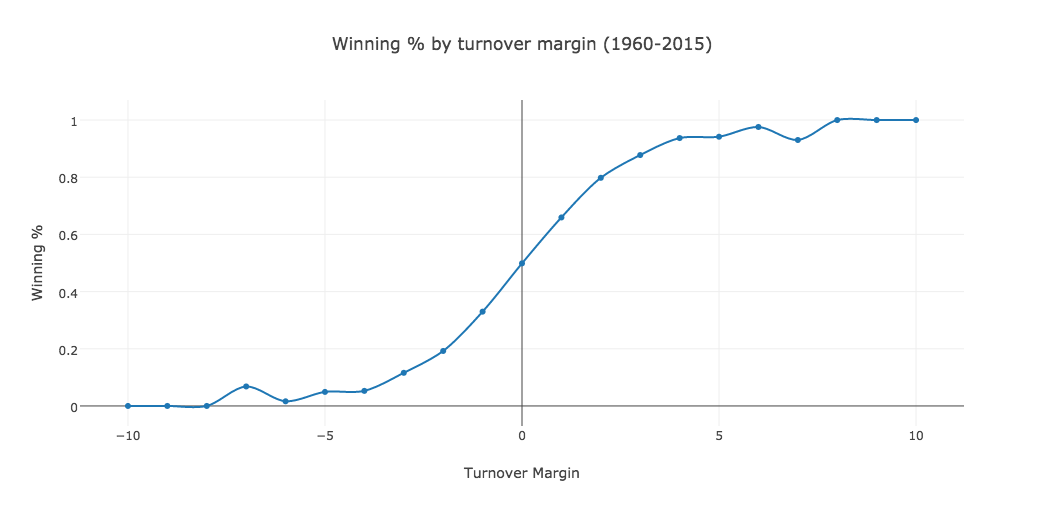
With an even turnover margin, teams have historically had a 50/50 shot of winning, and as the turnover margin increases, we see a definite increase in win percentage. Interestingly enough, at a turnover margin of +7, we see a tiny dip in the win percentage. At first I thought my numbers might be wrong but after double checking, there have been 3 teams since 1960 to have lost a game after a +7 turnover margin performance:
- 1961 Minnesota Vikings vs San Francisco 49ers
- 1967 Chicago Bears vs Green Bay Packers
- 1983 Tennessee Titans vs Pittsburgh Steelers
Lastly, let’s look at how season long turnover margin correlates to winning percentage. To do this, I took the winning percentage of each team at each season and graphed that against their turnover margin for that season:
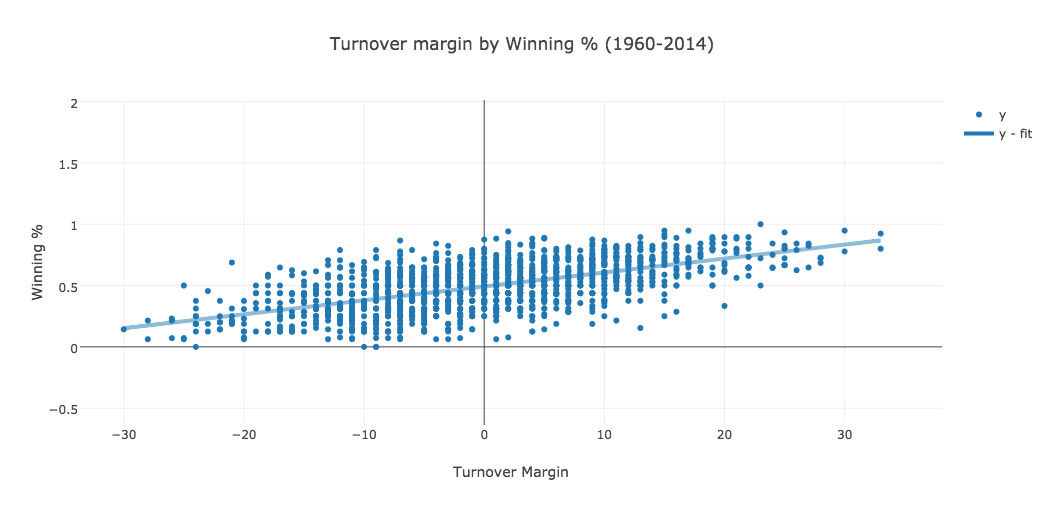
You can definitely see a positive correlation between the two. The linear regression line had a coefficient of determination of 0.37.
That’s it for now, feel free to download the data set and play with it yourself!